


By Alex Flitton on March 12, 2020 at 10:30 AM
The QSEHRA has been a demonstrably effective health benefits tool for businesses throughout the United States for several years now. However, nonprofit organizations have not received the same attention as regular businesses, despite their distinct needs and dramatic influence on the American economy.
In our 2020 annual report on how nonprofit organizations used the QSEHRA, we take the opportunity to separately evaluate the nonprofit space, measure the allowances they offer to employees year over year, and based on the size of each organization.
PeopleKeep encourages nonprofit employers to use this benchmark data to see how their organization’s health benefits compare to other nonprofits, and more effectively position themselves to attract and retain employees.
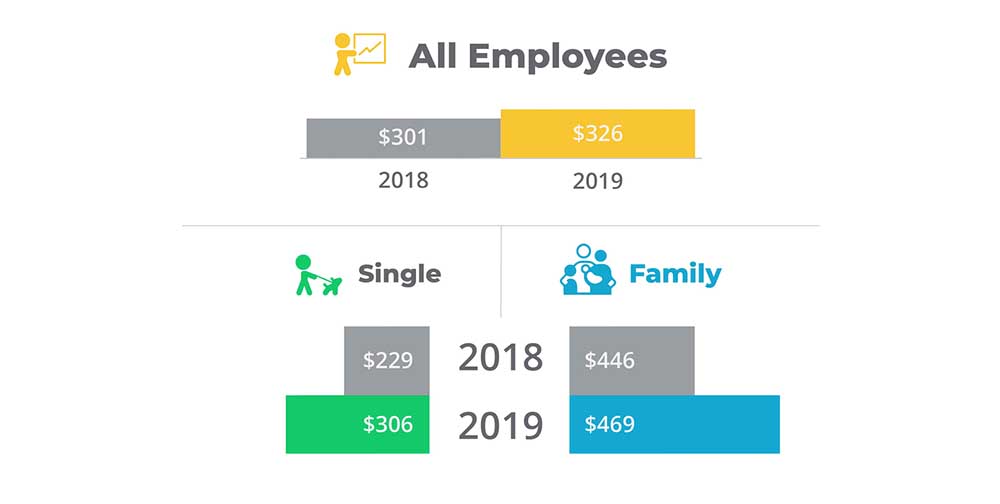
Average allowances by family status
In 2019, the average allowance amount, across all nonprofit organizations and employees, regardless of family type, was $326/month. In one year, the amount increased $25 per month. As we look closer at family types, we see that blog single employees and employees with a family increased their monthly allowance amounts.
Single employees saw an increase of $77, and employees with a family saw an increase of $23.
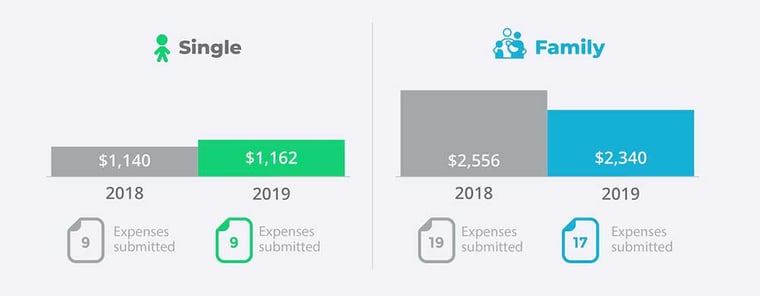
Average reimbursement totals - year-over-year
One other thought-provoking statistic, is change in average reimbursement totals. Employees with families, on average, have spent less on premiums and out-of-pocket expenses than in 2018. We saw similar reductions in reimbursements in our QSEHRA Annual Report for all businesses and organizations.

The only category of employees that increased reimbursement totals from 2018 was single employees. For that family type, spending increased only $22 for the entire year.
One final set of statistics worth calling out, is the average number of reimbursements made, year over year. All users, on average, submitted 14 reimbursements in a 12 month period. Single employees submitted an average of 9 expenses, and employees with a family submitted an average of 17 reimbursements in a 12 month period.
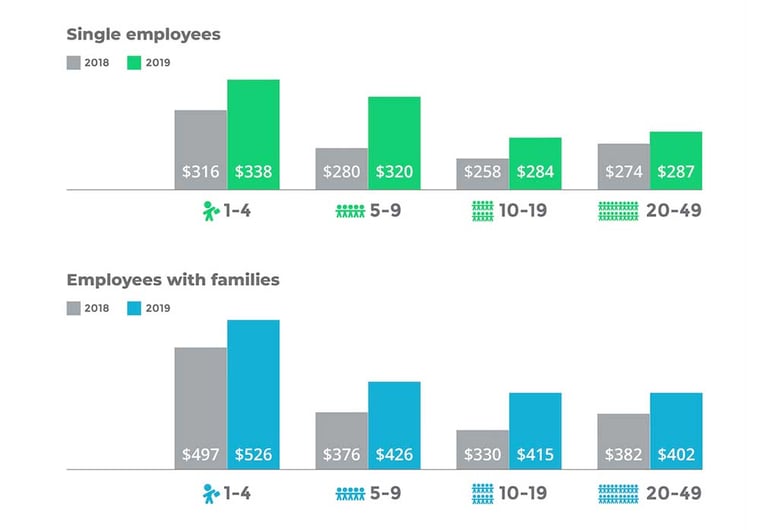
Average monthly QSEHRA use by number of employees
2019 saw a strong increase in QSEHRA use, especially in the nonprofit sector. As we saw in the 2020 QSEHRA Annual Report, most traditional businesses saw a decrease in spending, whereas engagement remained steady, and in some states, even increased.
In the figure below, we see that nonprofit organizations with 1-4 employees saw the greatest increase in monthly QSEHRA use. And as we compared them with larger nonprofits, average use decreased.
This graph actually demonstrates exactly how group health insurance rates decrease over time. As a greater number of employees enters a pool, the average risk per employee decreases. As we see below, the average monthly cost per employee in a company with 1-4 employees was $338/month. However, a nonprofit organization with 20-49 employees had an average cost of only $287; a difference of $51.
Percentage of allowance amounts used on insurance premiums for all nonprofit employees
The graphic below shows the average percentage of allowance amounts used on individual health insurance premiums is 76% leaving employees 24% of their allowance to use on eligible out-of-pocket expenses.

And finally, the final graphic shows that more than half of employers are offering allowance amounts that exceed the cost of employees' health insurance premiums. Essentially, for 46% of nonprofit employees, they use their entire allowance amount to pay for health insurance premiums, but do not have extra money for out-of-pocket expenses.

What we learned in the first 90 days of the individual coverage HRA
The long-anticipated individual coverage HRA (ICHRA) finally went into effect on January 1, 2020. Here is our 90-day report on how employers have used it.

What is the CHOICE Arrangement? ICHRA could become CHOICE
Congress is considering legislation that includes an overhaul and rebranding of the ICHRA into the CHOICE Arrangement.

Federal government releases final rule on new HRAs for 2020
The Trump administration issued final rules on the new ICHRA and excepted benefit HRA, with a start date of January 1, 2020. Here's a summary.